
Live NHL broadcasts have always relied on speed, instinct and narrative; however, you are now watching a game increasingly driven by real‑time data. Shot counts, expected goals and puck tracking have changed how plays are explained: the NHL’s EDGE platform now captures about 12 million data points per game from sensors and high‑speed cameras, tracking everything from skating speed to puck position. Today, broadcasts are beginning to show what large groups believe is likely to happen next, beyond simply what just occurred.
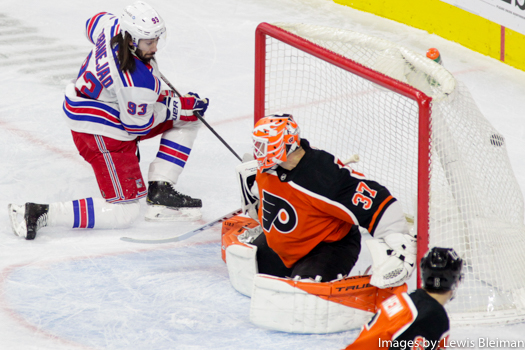
Mika Zibanejad #93 of the New York Rangers collects a goal against Brian Elliott #37 of the Philadelphia Flyers
That recalibration changes how you perceive momentum, pressure and risk as a game unfolds: when probabilities move after a goal or penalty, you are seeing collective judgment react almost immediately to on‑ice events. This does not replace traditional commentary, ultimately sharpening it; as the NHL expands its data partnerships, probability is moving into the broadcast foreground, giving you another way to read the game in real time.
League partnerships and market-driven insight
The NHL has recently entered formal partnerships with regulated prediction market platforms, granting access to official league data and licensed branding. This step matters because it places prediction markets within the league’s approved data ecosystem rather than on the fringes. For you, that means probability signals drawn from real trading activity may increasingly appear in mainstream coverage, in markets that respond to goals, injuries and momentum shifts, often faster than traditional analysis can explain them.

When a late power play changes expectations, the market reflects that shift almost immediately. In the broader sports picture, this development parallels how betting-adjacent features have become normalized on broadcasts, especially as online sports betting expands across the United States. Ultimately, the NHL’s approach suggests confidence that viewers can engage with probabilistic information responsibly when it is presented as context, with you being shown how expectations shift in real time.
Broadcast integration and second-screen behavior
Broadcasters are already experimenting with ways to blend live data into the viewing experience, particularly for fans who watch with a phone or tablet nearby. Some regional networks now display real-time bet tracking or odds movement during games, allowing you to see how expectations shift alongside the action, with prediction market data fitting naturally into this context because it behaves like a living signal.
As trades occur, probabilities move, so those movements can be visualized during stoppages or key moments. For you, this creates a more interactive venture, even if you never place a wager; you can compare what you feel while watching a comeback develop with what the market suggests about its likelihood. That comparison encourages deeper engagement, turning passive viewing into active interpretation without requiring constant attention away from the ice.
How prediction markets translate play into probabilities
Prediction markets work by allowing participants to trade contracts tied to specific outcomes, with prices representing implied probabilities. When new information appears during a game, trading activity adjusts almost instantly, pushing those probabilities up or down, and unlike traditional odds that update in stages, prediction markets often move continuously. For you, that responsiveness can be revealing during chaotic stretches of play.
A dominant shift, a controversial call or a goaltender standing on their head may all register quickly in market behavior. When broadcasters explain these movements, probability becomes part of the story, where you start to see how collective belief reacts to nuance. Over time, this can sharpen how you interpret risk and momentum, aligning intuition with measurable signals that reflect thousands of independent judgments.
Using probability to deepen hockey storytelling
Modern broadcasts aim to tell smarter stories, so probability data adds another narrative tool. Expected goals models already explain why a 2–1 game may feel lopsided, with prediction markets potentially extending that logic forward. When win probabilities shift despite a tied score, you gain insight into why analysts view one team as controlling the game. For you, this framing can make strategy discussions more concrete.
Meanwhile, commentators can point to probability swings when explaining line changes, defensive adjustments or timeout decisions; instead of relying solely on hindsight, broadcasts can discuss changing expectations as part of the live narrative. When used carefully, these elements enrich the emotion of hockey by connecting feeling with data, so you remain focused on the action, but with a clearer sense of why certain moments carry outsized weight.
Challenges, balance and what lies ahead
Integrating prediction market data into NHL broadcasts requires restraint and thoughtful design. Too much information risks overwhelming viewers, particularly during fast sequences when attention should stay on the puck, so broadcasters must choose moments where probability adds clarity rather than noise. For you, the value lies in selective insight. Moreover, there are also regulatory and ethical considerations, as leagues and networks navigate how closely probability data should sit next to wagering content. 
The NHL’s current approach suggests a measured rollout: looking ahead, prediction market signals are likely to become one of several complementary tools influencing hockey coverage. As familiarity grows, you may find these probabilities as intuitive as shot charts or possession metrics. Ultimately, the result is a viewing experience that feels sharper, more informed and better aligned with how modern fans process the game.
- NHL partners with prediction markets. In 2025, Kalshi and Polymarket gained official access to NHL data and broadcasts, including Stanley Cup events.
- EDGE data powers broadcasts. The NHL tracks millions of in-game data points per match, including player speed and puck location, for advanced analytics.
- Market activity reflects engagement. Nearly $980,000 was traded on Kalshi’s 2026 Stanley Cup contracts, showing strong real-time fan interest.
