
(Graphic: David Strover)
BILLINGHAM, UK – Blackburn Hawks and Solihull Barons both continued their downward slides this weekend as they faced off against the big three.
Blackburn lost out by an aggregate of 17-4 against Sheffield Steeldogs and Telford Tigers, while Solihull had a double-header against Hull Pirates in which they were outscored 21-3.
The Hawks have subsequently added Robin Kovar to bolster their attack, but that may be papering over the cracks as the team has the worst save percentage in the league.
Team Stats
Things stayed very much the same in terms of shooting percentages this week. Nottingham Lions, Whitley Warriors, Blackburn and Solihull all dropped slightly in terms of percentage, but of those only the Barons lost position dropping below Solway Sharks.
As previously mentioned, Blackburn dropped to the foot of the table in regards to team save percentage dropping to 85.33%. The steady play of Miles Finney has been one of few bright spots for Nottingham over the last few weeks.
Billingham’s declining shooting percentage saw them fall below Solihull in the luck stakes as the Barons moved ahead of the Stars on the PDO front.
| Shooting % | Save % | PDO | |||||
| Telford | 16.09% | Sheffield | 92.53% | Telford | 107.49 | ||
| Hull | 14.91% | Hull | 92.51% | Hull | 107.42 | ||
| Sheffield | 13.49% | Telford | 91.40% | Sheffield | 106.02 | ||
| Solway | 12.10% | Solway | 89.25% | Solway | 101.35 | ||
| Solihull | 12.09% | Whitley | 87.98% | Solihull | 98.11 | ||
| Sutton | 11.08% | Nottingham | 87.27% | Billingham | 97.32 | ||
| Blackburn | 10.48% | Billingham | 87.05% | Whitley | 97.00 | ||
| Billingham | 10.27% | Solihull | 86.02% | Sutton | 96.56 | ||
| Whitley | 9.02% | Sutton | 85.48% | Blackburn | 95.81 | ||
| Nottingham | 7.78% | Blackburn | 85.33% | Nottingham | 95.05 | ||
Despite drops in both powerplay and penalty kill numbers, Solihull were able to move ahead of Billingham in overall special team efficiency, after the Stars allowed Sutton Sting to score three goals on three powerplay opportunities on Sunday. This solidified Sutton’s powerplay position opening up a 6.11% gap on Solway. Sheffield are the new PK leaders after allowing no goals on eight kills.

| Powerplay % | Penalty Kill % | Special Teams | |||||
| Telford | 40.00% | Sheffield | 89.02% | Telford | 122.76% | ||
| Sheffield | 32.14% | Hull | 88.10% | Sheffield | 121.16% | ||
| Hull | 30.86% | Whitley | 84.62% | Hull | 118.96% | ||
| Sutton | 28.09% | Telford | 82.76% | Whitley | 105.57% | ||
| Solway | 21.98% | Blackburn | 79.44% | Sutton | 104.83% | ||
| Whitley | 20.95% | Sutton | 76.74% | Solway | 97.39% | ||
| Solihull | 20.19% | Solway | 75.41% | Blackburn | 90.71% | ||
| Billingham | 17.39% | Billingham | 70.42% | Solihull | 88.11% | ||
| Blackburn | 11.27% | Solihull | 67.92% | Billingham | 87.81% | ||
| Nottingham | 7.69% | Nottingham | 64.76% | Nottingham | 72.45% | ||
Yet again Nottingham managed fewer than their season average in terms of shots on goal dropping them to an average of 18 shots for per game.
Blackburn dropped below Sutton in this category and will be thankful for the Lions presence on this list, as they sit second last in more categories than anyone else after dropping into 9th for shots on goal.
Looking at shots against, Billingham and Hull moved ahead of Solihull and Telford respectively. However, overall shot differential stays in the same order as last week.
| Shots For Per Game | Shots Against Per Game | Shot Differential | |||||
| Hull | 54.86 | Sheffield | 26.78 | Hull | 26.95 | ||
| Telford | 48.59 | Hull | 27.91 | Telford | 20.59 | ||
| Sheffield | 45.13 | Telford | 28.00 | Sheffield | 18.35 | ||
| Whitley | 42.30 | Solway | 31.90 | Solway | 9.81 | ||
| Solway | 41.71 | Whitley | 38.22 | Whitley | 4.08 | ||
| Billingham | 37.10 | Sutton | 39.83 | Billingham | -5.19 | ||
| Solihull | 34.40 | Blackburn | 40.57 | Sutton | -5.70 | ||
| Sutton | 34.13 | Billingham | 42.29 | Blackburn | -6.95 | ||
| Blackburn | 33.62 | Solihull | 43.20 | Solihull | -8.80 | ||
| Nottingham | 18.00 | Nottingham | 68.20 | Nottingham | -50.20 | ||
Even strength scoring is where we see the real drop off from Solihull. Yes, they were playing against high quality opposition this week, but all of these stats are season averages and so paint a fairly accurate picture of the season on a whole after the halfway marker.
Despite no movement in terms of even strength goals for, eight of the ten teams saw a decline in even strength scoring with Billingham and Telford maintaining their average. Goals against at even strength saw Solihull allowing 0.4 more goals per game dropping them below both Billingham and Sutton and into 9th place for this stat.
Finally, Solihull’s most shocking drop is a three place slide into 8th in even strength differential, while Sutton stay 7th, Billingham jump two spots to 6th and Whitley move up into 5th.
| Even Strength For | Even Strength Against | Even Strength Diff | |||||
| Hull | 6.64 | Hull | 1.45 | Hull | 5.18 | ||
| Telford | 6.05 | Sheffield | 1.52 | Telford | 4.41 | ||
| Sheffield | 4.74 | Telford | 1.64 | Sheffield | 3.22 | ||
| Solway | 3.81 | Solway | 2.48 | Solway | 1.33 | ||
| Solihull | 3.04 | Whitley | 3.63 | Whitley | -0.96 | ||
| Sutton | 3.00 | Billingham | 4.05 | Billingham | -1.14 | ||
| Billingham | 2.90 | Sutton | 4.17 | Sutton | -1.17 | ||
| Blackburn | 2.81 | Solihull | 4.44 | Solihull | -1.40 | ||
| Whitley | 2.67 | Blackburn | 4.62 | Blackburn | -1.81 | ||
| Nottingham | 1.00 | Nottingham | 6.68 | Nottingham | -5.68 | ||
Individual Stats
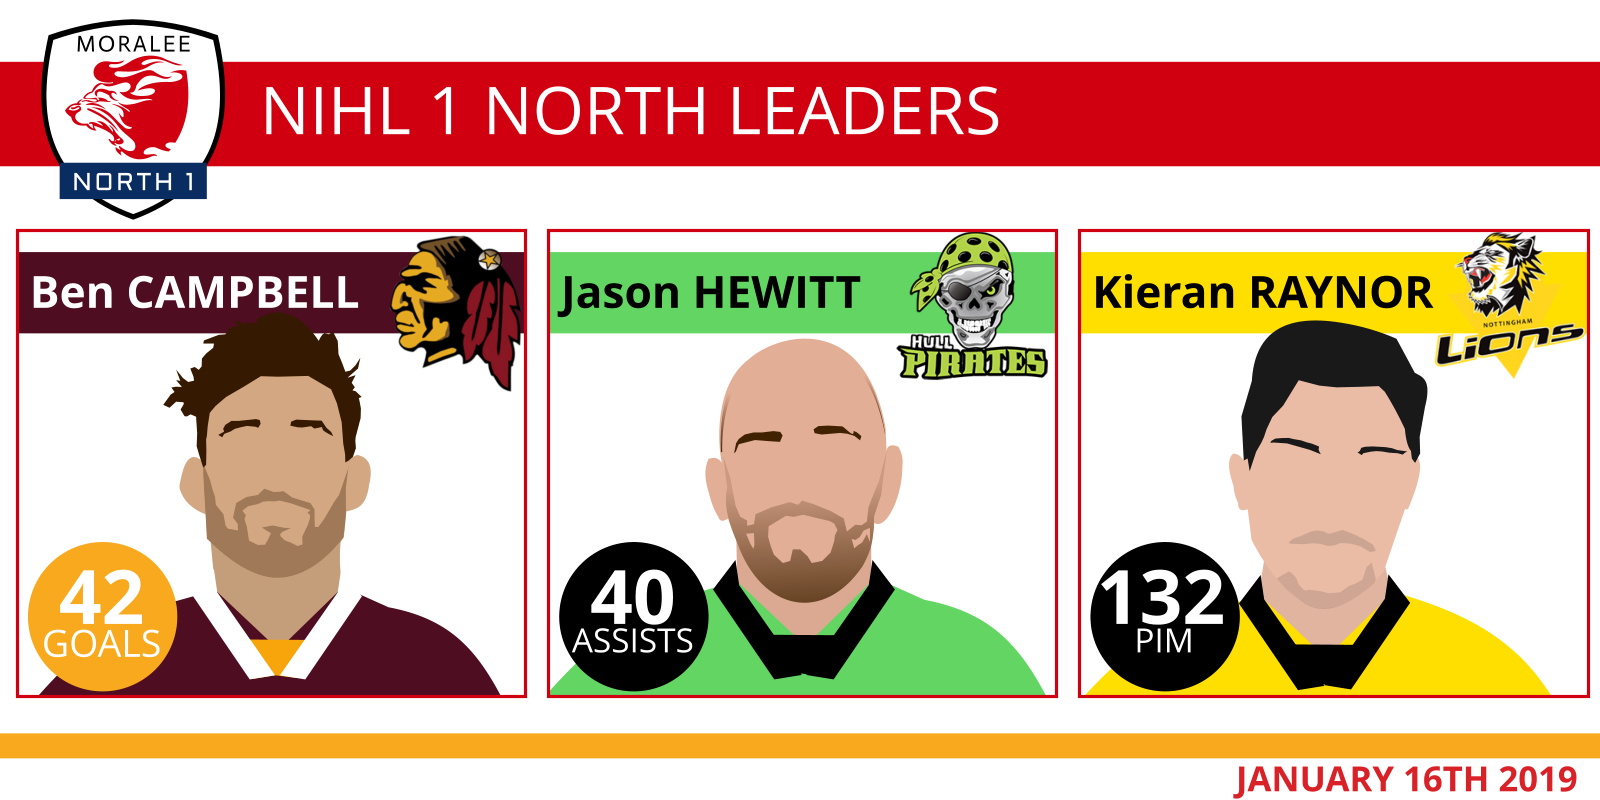
Hull’s Jason Hewitt keeps his position at the top of the points list as he has done since the weekend of 3rd and 4th November and has extended his lead to 14 points. Fellow Pirates Lee Bonner (4th) and Bobby Chamberlain (5th) join him in the top 10.
Top goalscorer is Whitley’s Ben Campbell who keeps hold of 2nd place in the points standings. However, he is being put under pressure from Telford’s Doug Clarkson (3rd) who scored nine goals and registered three helpers for twelve points this weekend.
Clarkson is joined by teammates Scott McKenzie (6th), Andrew McKinney (9th) and Jonathan Weaver (=10th). Sheffield are represented by Ashley Calvert (7th) and Milan Kolena (8th).
Solihull’s Niklas Ottosson is still technically in the top 10 as he shares 10th spot with Weaver, but has the same number of points in seven more games meaning he does not feature in the table for the first time this season.
| Name | Team | GP | G | A | P | PPG |
| J Hewitt | Hull | 22 | 36 | 40 | 76 | 3.45 |
| B Campbell | Whitley | 26 | 42 | 20 | 62 | 2.38 |
| D Clarkson | Telford | 17 | 37 | 21 | 58 | 3.41 |
| L Bonner | Hull | 21 | 24 | 30 | 54 | 2.57 |
| B Chamberlain | Hull | 15 | 23 | 26 | 49 | 3.27 |
| S McKenzie | Telford | 17 | 18 | 30 | 48 | 2.82 |
| A Calvert | Sheffield | 22 | 34 | 13 | 47 | 2.14 |
| M Kolena | Sheffield | 21 | 15 | 31 | 46 | 2.19 |
| A McKinney | Telford | 20 | 11 | 34 | 45 | 2.25 |
| J Weaver | Telford | 18 | 8 | 36 | 44 | 2.44 |
Remaining team leaders not featuring in the top 10 are as follows:
| Name | Team | GP | G | A | P | PPG | Position |
| N Ottosson | Solihull | 25 | 14 | 30 | 44 | 1.76 | =10th |
| S Lascek | Sutton | 23 | 15 | 25 | 40 | 1.74 | =14th |
| P Valusiak | Blackburn | 20 | 15 | 18 | 33 | 1.65 | =21st |
| C Sykes | Billingham | 21 | 14 | 19 | 33 | 1.57 | =21st |
| R Bentham | Solway | 20 | 13 | 17 | 30 | 1.50 | =26th |
| R Hughes | Nottingham | 22 | 14 | 6 | 20 | 0.91 | =46th |
Top 5 Netminders
The top 5 netminders stay the same this week with only minor changes to save percentages.
| Name | Team | SAG | GA | SAVE % |
| D Zimozdra | Sheffield | 387 | 27 | 93.02% |
| B Stones | Sheffield | 207 | 16 | 92.27% |
| B Day | Hull | 345 | 27 | 92.17% |
| T Hovell | Telford | 314 | 26 | 91.72% |
| M Finney | Nottingham | 727 | 69 | 90.51% |
| Min 150 shots |
The Lowe Down
This weekend could be make or break at the bottom end of the play-off race as Billingham take on faltering Solihull and Blackburn. The way things have been going over the last few weeks, Sting could leapfrog the Barons and those three teams will be battling for the last two play-off places.
In reality Solihull are possibly already out of Billingham’s reach, meaning their play-off place will be safe as they still have one remaining fixture against Nottingham.
Blackburn still have two games left against the league’s bottom side, while Billingham have played the Lions all four times already. If Billingham are to get out of their current situation and into the play-off picture, they need to at least beat Blackburn on Sunday.
