
(Image permission: David Strover)
BILLINGHAM, UK – After an unavoidable absence last week we are back to take a look at how Moralee D1 teams are shaping up by the numbers.
Solihull Barons had the benefit of facing Nottingham Lions which has boosted their statistics this weekend, although not as much as they maybe would have hoped as you will see when it comes to the shots on goal stats.
Team Stats
Team shooting percentage positions stayed the same as they were two weeks ago, with Telford Tigers continuing to lead the way followed by title rivals Hull Pirates and Sheffield Steeldogs.
Hull are the new team save percentage leaders after Sheffield conceded 11 goals over the last two weekends. Solihull moved ahead of Billingham Stars in team save percentage.
PDO saw Billingham take a bit of a nosedive after their 10-2 defeat at the hands of the Pirates and seeing their shooting percentage drop below 10% for the first time this season.
| Shot % | Save % | PDO | |||||
| Telford | 16.12% | Hull | 92.04% | Telford | 107.19 | ||
| Hull | 14.93% | Sheffield | 91.81% | Hull | 106.97 | ||
| Sheffield | 13.56% | Telford | 91.07% | Sheffield | 105.37 | ||
| Solway | 12.36% | Solway | 88.84% | Solway | 101.20 | ||
| Solihull | 12.07% | Whitley | 87.89% | Solihull | 99.10 | ||
| Sutton | 11.25% | Nottingham | 87.09% | Whitley | 97.16 | ||
| Blackburn | 10.99% | Solihull | 87.03% | Sutton | 96.83 | ||
| Billingham | 9.91% | Billingham | 86.73% | Billingham | 96.64 | ||
| Whitley | 9.27% | Sutton | 85.58% | Blackburn | 96.47 | ||
| Nottingham | 7.93% | Blackburn | 85.48% | Nottingham | 95.02 | ||
Hull saw a 4.43% rise in the powerplay over the past two weeks to move them ahead of Sheffield in this department. This was mostly due to scoring three goals on the same five minute major against Nottingham two Sundays ago.

Solihull also made use of a game against the Lions to move ahead of Whitley Warriors. Nottingham’s torrid time on the penalty kill has seen their percentage on this take a dip into new territory – the 50s.
Telford overtook the team they should have faced on Sunday night, Whitley, to move into 3rd. In terms of overall special team efficiency, Hull have leapfrogged both Sheffield and Telford and taken top spot from the Tigers.
Sutton Sting and Solihull also moved up a place with Whitley and Blackburn Hawks moving down.
| Powerplay % | Penalty Kill % | Special Teams | |||||
| Telford | 37.93% | Sheffield | 87.21% | Hull | 121.75% | ||
| Hull | 35.29% | Hull | 86.46% | Telford | 121.60% | ||
| Sheffield | 32.58% | Telford | 83.67% | Sheffield | 119.79% | ||
| Sutton | 29.47% | Whitley | 83.18% | Sutton | 105.23% | ||
| Solway | 22.32% | Blackburn | 78.05% | Whitley | 103.55% | ||
| Solihull | 22.03% | Sutton | 75.76% | Solway | 97.32% | ||
| Whitley | 20.37% | Solway | 75.00% | Solihull | 91.78% | ||
| Billingham | 16.96% | Billingham | 73.49% | Blackburn | 91.30% | ||
| Blackburn | 13.25% | Solihull | 69.75% | Billingham | 90.45% | ||
| Nottingham | 8.25% | Nottingham | 57.28% | Nottingham | 65.53% | ||
Despite another defeat, Nottingham actually improved on their shot totals against Solihull. The Lions managed 30+ shots for the first time since 4th November against Blackburn and only the third time this season.
On top of this the Lions ‘only’ gave up 59 shots on goal, their lowest total since 9th December, again against Blackburn.
Sutton saw a drop in their shots against standings losing ground to Blackburn and Billingham. Sutton also dropped in overall shot differential swapping places with Solihull.
| Shots For Per Game | Shots Against Per Game | Shot Differential | |||||
| Hull | 57.08 | Sheffield | 26.88 | Hull | 29.44 | ||
| Telford | 48.40 | Hull | 27.64 | Telford | 19.72 | ||
| Sheffield | 45.12 | Telford | 28.68 | Sheffield | 18.24 | ||
| Whitley | 42.75 | Solway | 31.92 | Solway | 10.48 | ||
| Solway | 42.40 | Whitley | 38.04 | Whitley | 4.71 | ||
| Billingham | 36.58 | Blackburn | 41.32 | Billingham | -5.17 | ||
| Solihull | 35.21 | Billingham | 41.75 | Solihull | -7.75 | ||
| Sutton | 33.50 | Sutton | 42.42 | Blackburn | -8.56 | ||
| Blackburn | 32.76 | Solihull | 42.96 | Sutton | -8.92 | ||
| Nottingham | 18.22 | Nottingham | 68.56 | Nottingham | -50.34 | ||
One game in particular did not see much movement at even strength. Nottingham versus Solihull saw just three of the ten goals scored at even strength at a score of 2-1 in favour of Solihull.
The Barons did however score two short-handed goals in the game. Because of this game Solihull dropped below Sutton in terms of even strength goals for.
Billingham also dropped with Blackburn and Whitley moving ahead of them. Solihull move ahead of Sutton when looking at even strength goals conceded and leapfrog both the Sting and the Stars for even strength differential.
| Even Strength For | Even Strength Against | Even Strength Diff | |||||
| Hull | 6.96 | Hull | 1.52 | Hull | 5.44 | ||
| Telford | 6.08 | Sheffield | 1.68 | Telford | 4.24 | ||
| Sheffield | 4.80 | Telford | 1.84 | Sheffield | 3.12 | ||
| Solway | 4.00 | Solway | 2.60 | Solway | 1.40 | ||
| Sutton | 2.96 | Whitley | 3.57 | Whitley | -0.71 | ||
| Solihull | 2.93 | Billingham | 4.29 | Solihull | -1.43 | ||
| Blackburn | 2.88 | Solihull | 4.36 | Billingham | -1.54 | ||
| Whitley | 2.86 | Sutton | 4.54 | Sutton | -1.58 | ||
| Billingham | 2.75 | Blackburn | 4.68 | Blackburn | -1.80 | ||
| Nottingham | 1.04 | Nottingham | 6.63 | Nottingham | -5.59 | ||
Individual Stats
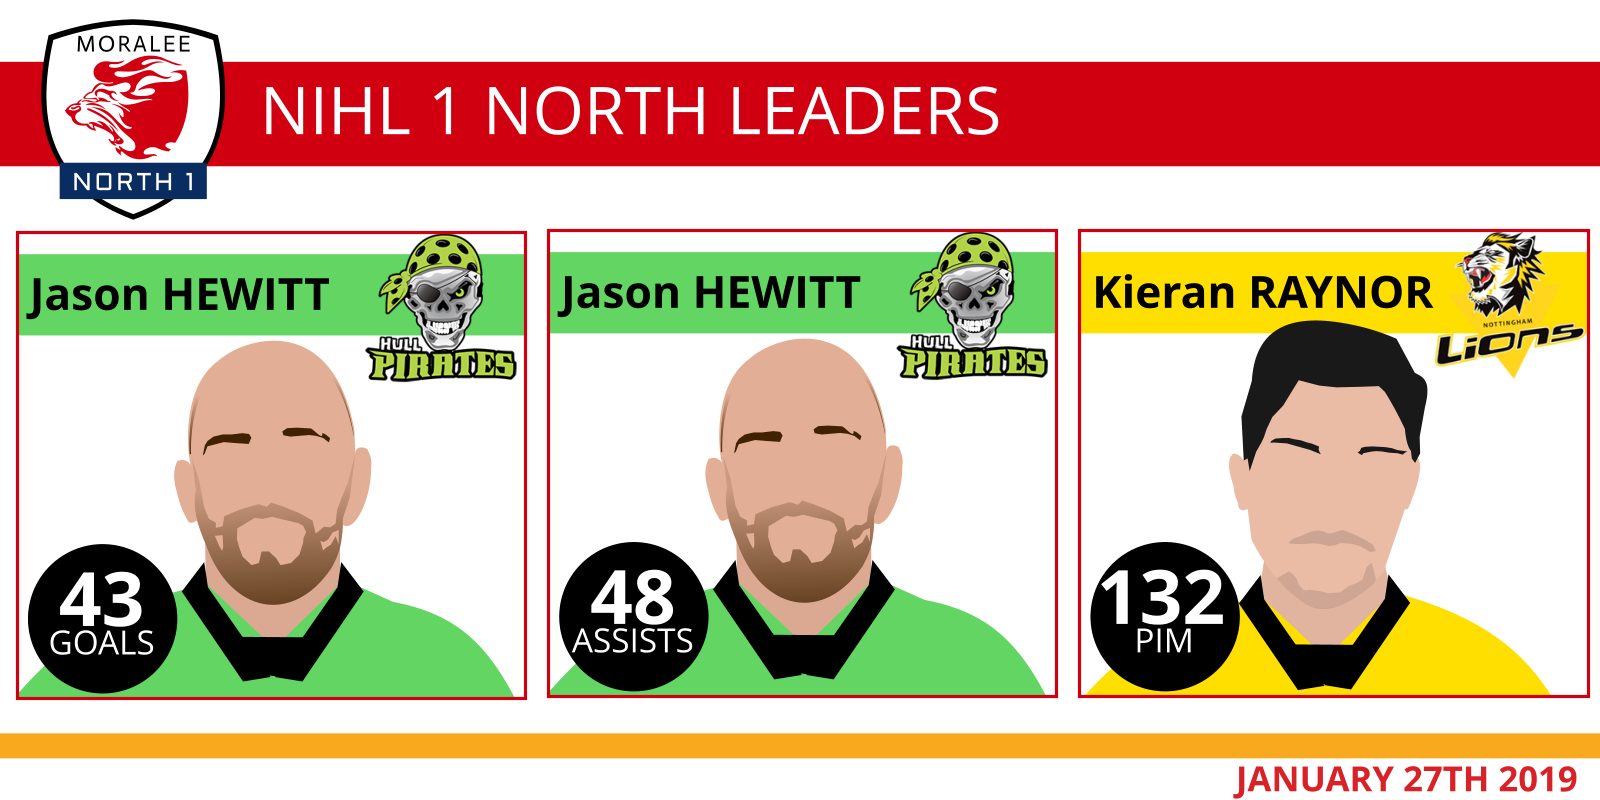
Jason Hewitt is now 27 points clear atop the points standings leading in both goals and assists after logging 15 points in three games since the last blog. Hewitt is joined by teammates Bobby Chamberlain (4th) and Lee Bonner (6th) in the top 10.
Telford’s Doug Clarkson shares second position with Ben Campbell, although he has played six fewer games than the Warriors star. Clarkson is joined in the top 10 by Scott McKenzie (5th), Andrew McKinney (7th) and the only ‘D’ man in the top points scorers, Jonathan Weaver (8th).
Rounding out the top scorers are Solihull’s Niklas Ottosson (9th) and Sheffield’s Ashley Calvert (10th).
| Name | Team | GP | G | A | P | PPG |
| J Hewitt | Hull | 25 | 43 | 48 | 91 | 3.64 |
| D Clarkson | Telford | 20 | 40 | 24 | 64 | 3.20 |
| B Campbell | Whitley | 27 | 42 | 22 | 64 | 2.37 |
| B Chamberlain | Hull | 18 | 30 | 31 | 61 | 3.39 |
| S McKenzie | Telford | 20 | 24 | 36 | 60 | 3.00 |
| L Bonner | Hull | 24 | 25 | 34 | 59 | 2.46 |
| A McKinney | Telford | 23 | 14 | 37 | 51 | 2.22 |
| J Weaver | Telford | 21 | 10 | 40 | 50 | 2.38 |
| N Ottosson | Solihull | 28 | 15 | 35 | 50 | 1.79 |
| A Calvert | Sheffield | 24 | 35 | 14 | 49 | 2.04 |
Remaining team leaders not featuring in the top 10 are as follows:
| Name | Team | GP | G | A | P | PPG | Position |
| P Valusiak | Blackburn | 24 | 17 | 27 | 44 | 1.83 | 16th |
| S Lascek | Sutton | 24 | 17 | 26 | 43 | 1.79 | 17th |
| P Gapa | Solway | 25 | 23 | 17 | 40 | 1.60 | =20th |
| C Sykes | Billingham | 24 | 17 | 22 | 39 | 1.63 | =22nd |
| R Hughes | Nottingham | 24 | 15 | 8 | 23 | 0.96 | =44th |
Top 5 Netminders
The personnel in the top five netminders stay the same this week, with Brandon Stones dropping two places to 4th, while Brad Day and Tom Hovell each move up one spot from last time.
| Name | Team | SAG | GA | SAVE % |
| D Zimozdra | Sheffield | 387 | 27 | 93.02% |
| B Day | Hull | 345 | 27 | 92.17% |
| T Hovell | Telford | 415 | 37 | 91.08% |
| B Stones | Sheffield | 263 | 25 | 90.49% |
| M Finney | Nottingham | 800 | 79 | 90.13% |
| Min 150 shots |
The Lowe Down
Hello Hull fans, it has been a little while since your team was the focus of one of these.
In sport we often hear about people being bad losers – your team is getting blown out and you start making cheap, dirty, unnecessary plays.
Unfortunately there is also such a thing as a bad winner. On Sunday night that was what was seen in Billingham. With cup semi-finals looming large against local rivals Sheffield, James Archer and Lee Bonner could well have put themselves at a disadvantage.
With the score at 9-2 in the Pirates’ favour, Archer saw red against former teammate Cain Taylor. He chased him around the ice, delivering numerous cross-checks to a not interested opponent before having enough, dropping his gloves and delivering punches to an unsuspecting opponent. Taylor eventually dropped the gloves, but too late.
If we take previous rulings into account (Lewis Baldwin/Dean Holland) the precedent is set for a six-game ban, at the very least the minimum four-game ban for fighting.
Were Archer to get the six-game treatment, not only would he miss the cup clashes, he would also miss two league games against title rivals Telford.
Bonner on the other hand, with the score at 10-2, delivered a two-handed slash to Stars’ import Kristers Bormanis. At the rink the penalty was announced as a match penalty for slashing which carries with it a two-game suspension according to the EIHA disciplinary document.
The online game sheet only lists the penalty as a game penalty so Bonner could escape extra punishment, but if he does receive the two-game ban, then he too will miss both legs of the cup semi-final.
It will be interesting to see if the EIHA will stick to their own precedent in this matter with footage of both incidents readily available.
You must be logged in to post a comment.